
Case StudyHow A Service Company Discovered Their


How A Service Company Discovered Their
“Best” Customer Was Their Biggest Loss
A real story. Real numbers. And what happened at renewal time.
The Company
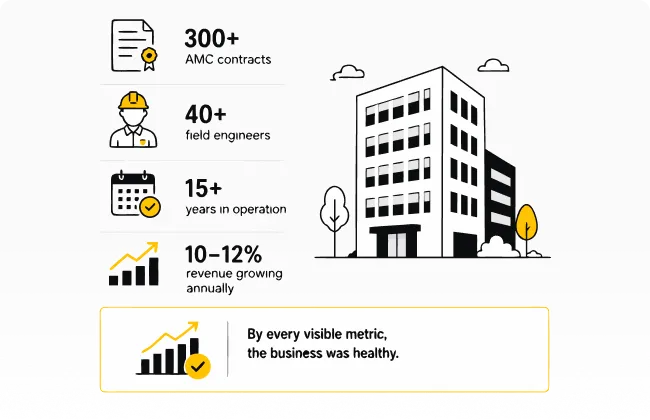
A mid-sized service company. 300+ AMC contracts. 40+ field engineers. 15+ years in operation. Revenue growing at 10-12% annually. By every visible metric, the business was healthy.
The Assumption
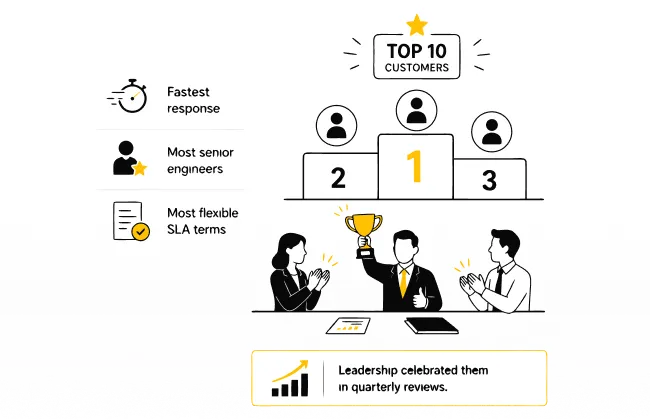
Their top 10 customers by revenue were treated as the most important accounts - fastest response, most senior engineers, most flexible SLA terms. Leadership celebrated them in quarterly reviews.
What They Discovered
When they tracked actual service costs at the customer level for the first time, the picture changed.
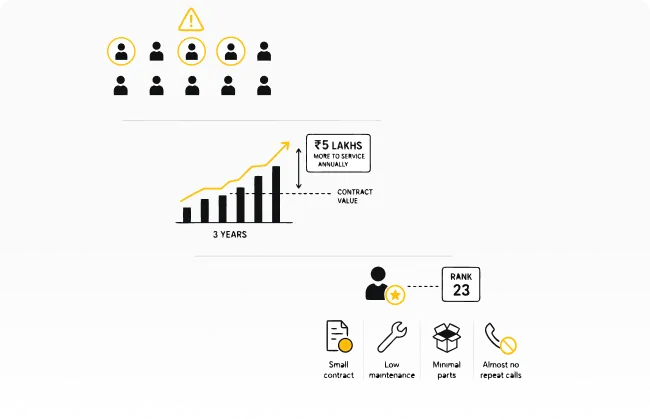
- 3 of their top 10 revenue customers were unprofitable - consuming more in service costs than they paid
- The largest account was costing ₹5 lakhs more to service annually than the contract was worth - and the gap had been growing for 3 years
- The most profitable customer in the entire portfolio was ranked 23rd by revenue - small contract, low maintenance, minimal parts, almost no repeat calls
Why It Was Hidden
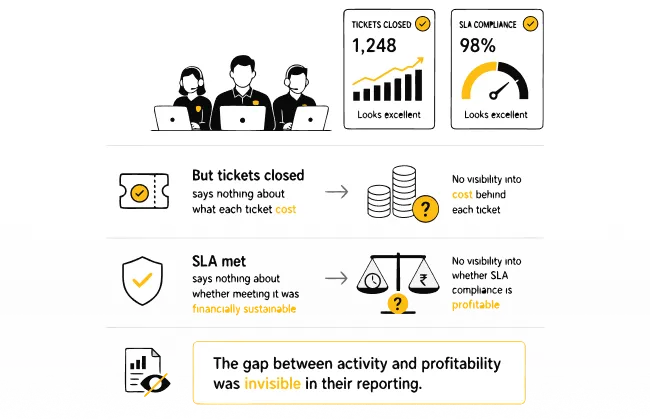
The service team measured tickets closed and SLA compliance. Both looked excellent for the top accounts. But tickets closed says nothing about what each ticket cost.
SLA met says nothing about whether meeting it was financially sustainable. The gap between activity and profitability was invisible in their reporting.
What They Did
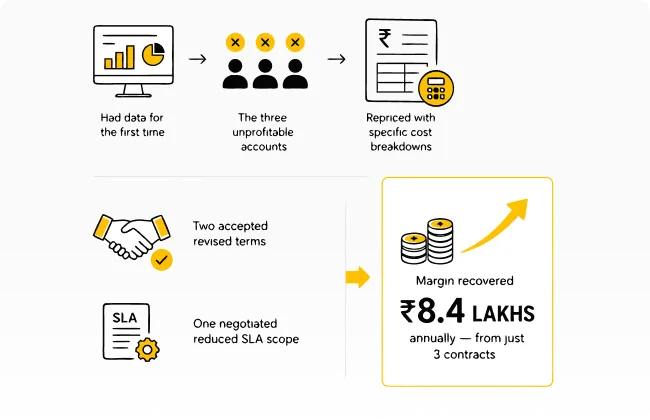
At renewal, they had data for the first time. The three unprofitable accounts were repriced with specific cost breakdowns. Two accepted revised terms. One negotiated reduced SLA scope.
Margin recovered: ₹8.4 lakhs annually - from just 3 contracts.
The Takeaway
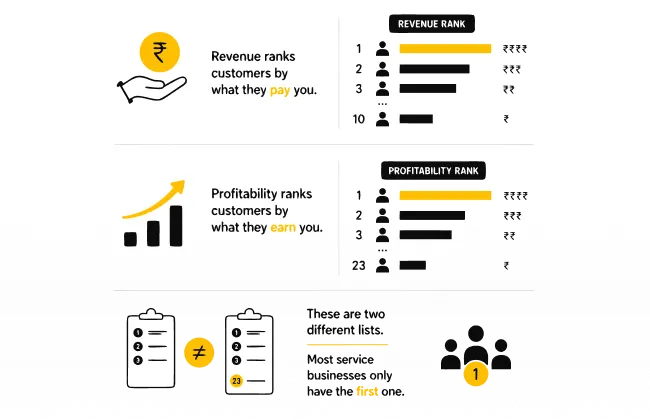
Revenue ranks customers by what they pay you. Profitability ranks customers by what they earn you. These are two different lists. Most service businesses only have the first one.
CONTACT US
Want to map this for your own customers?
Download the Customer Profitability Template - a one-page framework to start mapping profitability across your top 10 customers. We'll send it to your inbox.